Get started as a Public User
As a Public user to the NCSI Geostatistical Portal, you can Find datasets, Explore the data Catalogue, Preview
datasets, visualize them with Maps and Charts, Refine them with searches and filters, Download selected data
and share your maps. You can also subscribe to follow dataset updates.
Get started as a Register User
As a registered user with an account, you have access to additional content.
Find Datasets: Search & Filter
Quick Search
1)Text Search:
The search bar allows you to quickly find datasets in the catalogue. It searches for the entered text in the
metadata from all the available datasets: title. The catalog will be filtered to only display the matching datasets.
1. In the portal homepage, type the word(s) to search in the datasets; and press Enter.
2. All datasets that match the entered word(s) are displayed in the Catalogue.
2)Voice Search:
1. The voice-based search feature enables users to find the desired dataset by verbally stating its name using the microphone search tool.
Note: This feature is supported on all browsers except Firefox.
The Catalog is filtered according to the typed word(s):
View All Datasets
The View All Datasets allows you to browse all datasets in the portal in order to discover what’s available in
the catalogue.
1.
In the portal homepage, select ![]() .
.
2. All the datasets are displayed in the Catalogue.
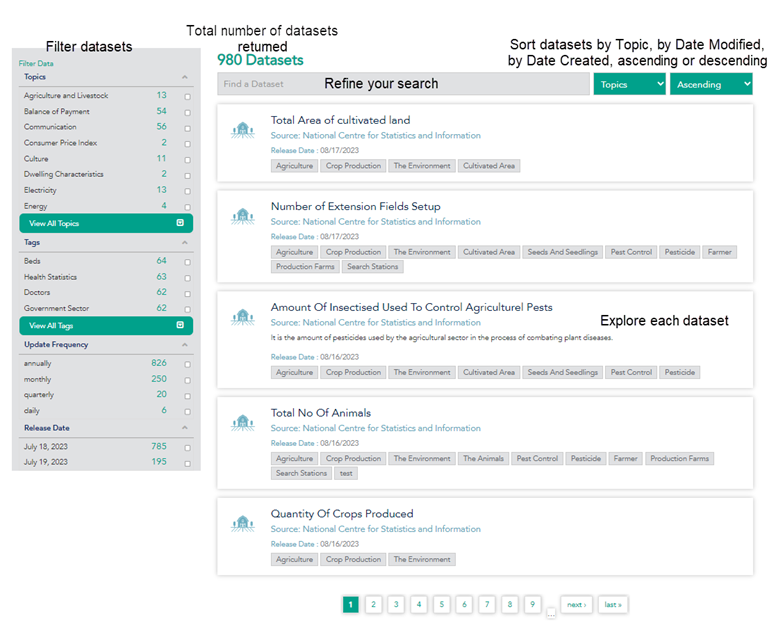
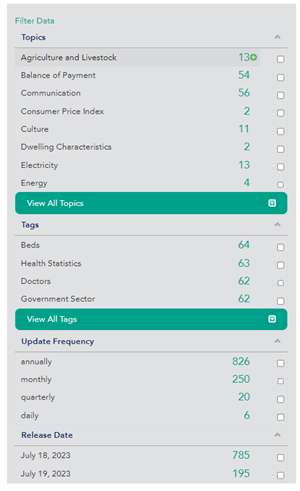
Filter Data
The NCSI Geostatistical Portal contains hundreds of datasets. A variety of filtering options are available to
help you find the dataset of interest.
|
|
You can filter the Data by: · Topic · Tags · Update Frequency · Release Date
Choose your filters: Under the name of the category of filters (i.e. Topic, Tags) are listed values (i.e. Energy, Culture are Topic values; Beds, Doctors are Tags values).
1. Click one of the values. The other values disappear and the catalog directly updates to only display datasets matching the newly applied filter.
The number of datasets available within each value is displayed.
2. Click on any other value to filter even more.
3. Click on a value again to unselect it. |
Explore Datasets
The Explore Dataset gives you access to all kind of information about the dataset:
1. You will find the dataset title its source
2. You can subscribe to dataset to be notified of updates
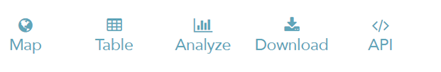
3. You are able to explore the dataset using the following available choices:
|
· Map · Table · Analyze |
· Download · API
|
4. Scroll down the page to discover more information about the datasets and its metadata
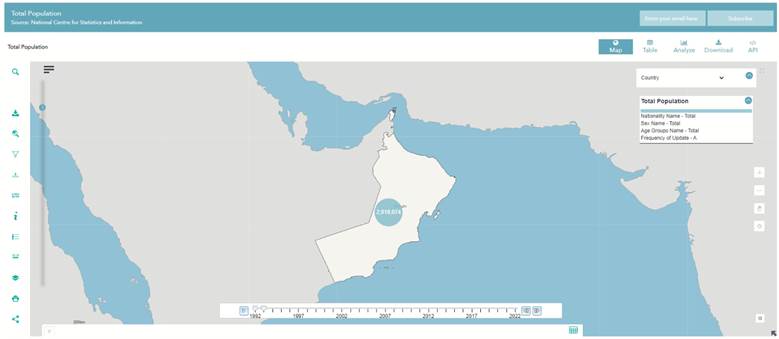
Visualize Data on a Map
By default, the dataset is displayed on the map (i.e. the Map representation is selected).
Refer to section Add Multiple Layers to Your Map for more details.
|
Note: All the datasets available in the Geostatistical Portal are geo-enabled. |
Visualize Data in a Table
Visualize data in a table allows you to discover the tabular values of the dataset.
1. Click on Table
The dataset’s table is displayed inside the Map Builder.
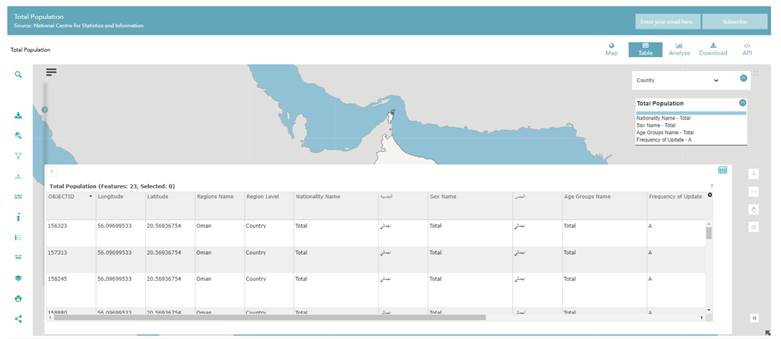
Refer to section Filter Dimensions from Table for more details.
Analyze Data in a Chart
Analyze data in a chart allows you to display the data graphically as a chart.
1. Click on Analyze
The dataset is displayed as a chart within the Chart Builder.
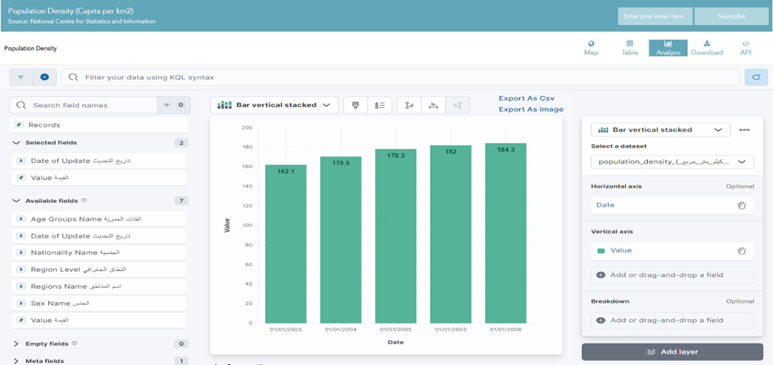
Refer to section Define Axis Options for more details.
Download Data
Download data allows you to export the data in several formats.
1. Click on Download
The dataset download options are displayed in the Map Builder.
Refer to section Download Data for more details.
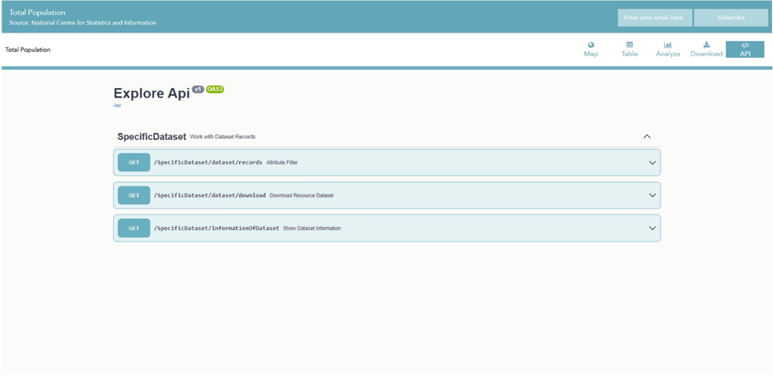
Explore Dataset’s API
Explore Dataset’s API allows you to access the rest end point of a dataset.
1. Click on API
The API component is displayed, so that you can build API queries on the dataset rest end.
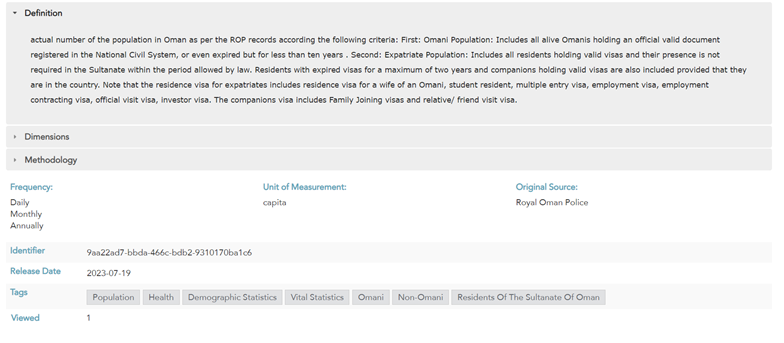
Check Dataset Info (metadata)
Discover detailed metadata about the dataset.
1. In the Explore Datasets page, scroll down to see the dataset’s metadata:
|
· Definition · Dimensions · Methodology · Frequency of Update · Unit of measurement · Original Source
|
· Dataset unique Identifier · Release Date · Next Release Date · Tags · Number of Views
|
Subscribe to a Dataset
Subscribe to a dataset allows you to be notified whenever the dataset is modified, or whenever new data
is added to the dataset. You can subscribe to one or more datasets you are interested in.
![]()
1. Type your email address in “Enter your email here” and click on Subscribe.
You will receive a message with a verification link to your email to verify your email address.
2. Login to your email and click the link in the message to verify your email address.
Once done, you will be subscribed to this dataset. You will receive email notification upon every new release.
|
Note: You can subscribe to as many datasets as you want. |
3. To unsubscribe, click Unsubscribe at the end of the email notification received. You will no longer
received email notifications upon new releases.
Overview of the Map Builder Interface
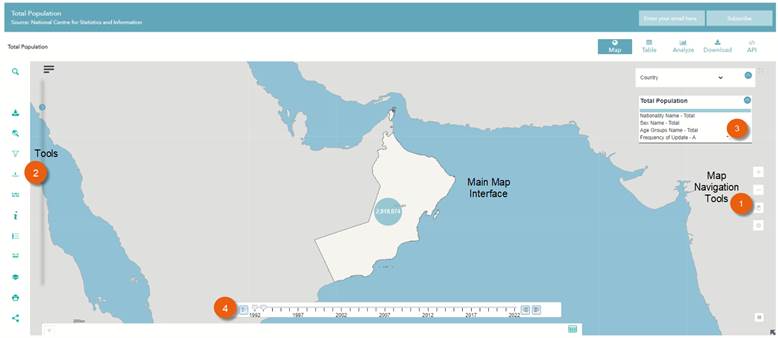
Map Navigation Tools

|
Zoom In |
The Zoom In allows you to see a more detailed view of a certain area on the map. |
|
Zoom Out |
The Zoom Out allows you to see larger map extents with less detail. |
|
Pan |
The Pan allows you to navigate your way through the map. By using this tool, you keep the same details but change the centrally-displayed area on the screen. |
|
Full Extents |
The Full Extent allows you to see the full extents of the map. Click the button to reset the map extent to the map initial extents (Oman Extent). |
|
Find My Location |
The Find my location allows you to zoom to your location on the map. |
Standard Tools 
|
Layer List |
The Layer List allows you to display a list of all layers added to the map. Layers may be datasets added from the Geostatistical Portal or other layers added using the Add Layer from URL tool. |
|
Identify |
The Identify allows you to see the tabular properties in a popup for a specific feature on the map. Note: This tool works only with portal datasets. It does not function with external datasets from outside the portal |
|
Measure |
The Measure tool allows you to measure the area of a polygon, the length of a line, or find the coordinates of a point location. |
|
Basemap Gallery |
The Basemap Gallery presents a gallery of NCSI basemaps and allows you to your map’s basemap. |
|
Legend* |
The Legend displays labels and symbols for layers in the map. |
|
Print Map |
The Print Map allows you to print the current extent of the map in different layouts, formats adding your own title. |
*Legend is also accessible in the layer list widget in the advance option at the level of each layer.
|
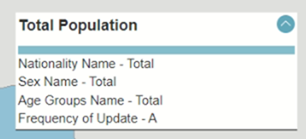
Filters Card
|
When one or more layers are added from the Geostatistical Portal, the Filter Cards lists the filters applied to each layer. |
|
Time Slider
|
All the datasets published on the portal are time enabled, which allows you to filter the data of this datasets by time. Refer to Time Filter |
Add Multiple Layers to Your Map
Add Layer/Indicator from the Geostatistical Portal
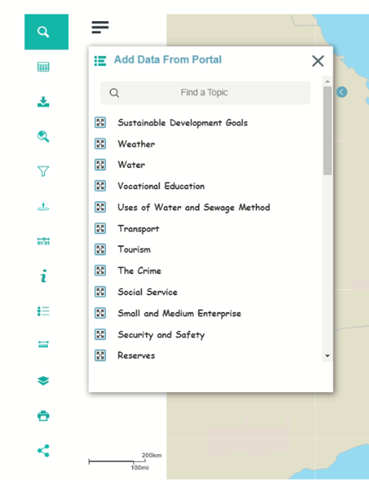
The Add Data From Portal allows you to add one or several datasets from the NCSI Geostatistical portal
as a layer to the Map Builder.
1. Click Add Data From Portal.
A list of all datasets available in the Geostatistical Portal is displayed, grouped by Topics.
2.
Expand ![]() a Topic to view its related datasets,
each dataset includes the following:
a Topic to view its related datasets,
each dataset includes the following:
· Title
· Description
· Tags
3. Find a Dataset: you can also search for a dataset in the search box.
4. Click Add To Map
The dataset is added as a layer to the map.
The filters applied to the dataset when added to the map are displayed in the filters card.
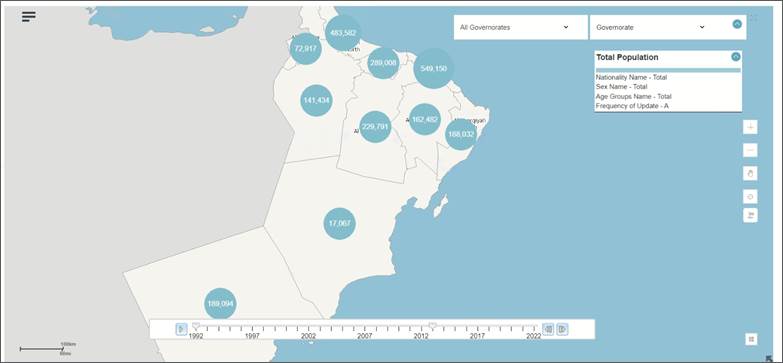
By default, the statistical value of the indicator is represented as a circle on the layer. The size of the
circle represents the range of the statistical value. Refer to the Legend for more details.
|
By default, the statistical data is displayed at the Country level. Zoom In to display the statistical data at the Governorate level. Zoom in more to display the data at the Wilaya level. |
|
Note: At any time, you can change the data filters of your dataset. Refer to Filter Data. |
|
Note: You can add as many datasets are you want to your map. Repeat the same process to add more datasets. ! Keep in mind that the more datasets you add to your map, the heavier it will be and the longer it will take to display. |
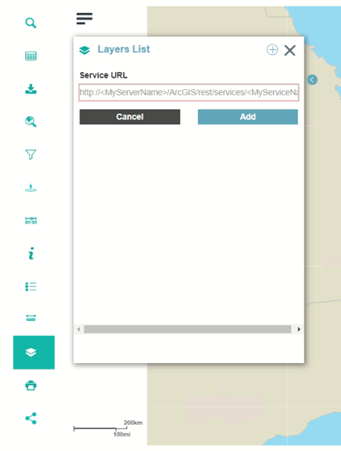
Add Layer from URL
Add layer from URL allows you to add data services to your map from different published sources other
than the Geostatistical portal.
|
1. Click Layers List tool In case any layers are added to the map, they appear in this widget. 2.
Click
3. Enter the URL click Add. The map service is added as layer to the map; it is also added to the layer list.
Repeat the same process to add multiple layers from URL to the map.
|
|
|
|
Note: All the Layers added to the map are listed in the layer list widget. There you can toggle on/off the layer visibility, Zoom to the layer extent or remove the layer from the display. |
|
|
Filter Data
Time Filter
All the datasets published on the portal are time enabled, which allows you to filter the data of this
datasets by time.
When a dataset is added from the Geostatistical Portal, the time filter is applied by default.
Refer to Add Layer/Indicator from the Geostatistical Portal.
|
Note: The Time Slider settings (interval, start time, end time…) are defined at the level of each dataset. They are dynamic to reflect the new data added to the dataset. |
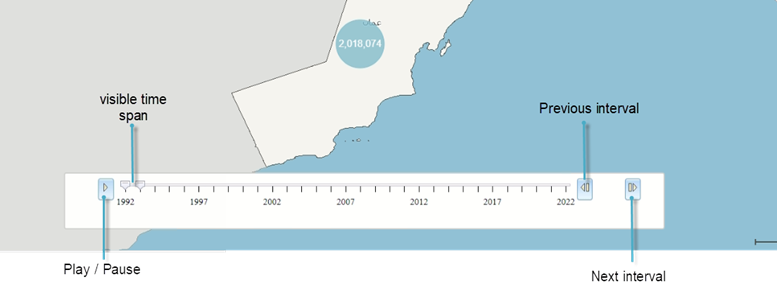
1.
Navigate through the time interval by sliding the curser
![]() or by the clicking the next
or by the clicking the next
interval ![]() or previous interval
or previous interval
![]() .
.
|
Notice that the statistical value displayed on the map is changed to reflect the applied filter. |
2.
Alternatively you can click on ![]() to play a time animation that steps
through the statistical values
to play a time animation that steps
through the statistical values
in
time sequentially. When playing, the Pause
![]() button appears in its
place.
button appears in its
place.
|
Note that if you add a layer from outside the portal, it may not be time-enabled, and therefore, the time filter will not be applicable to this layer. |
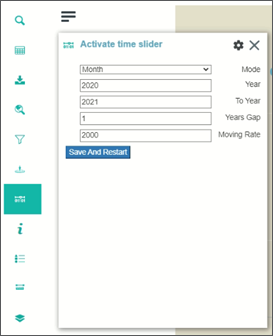
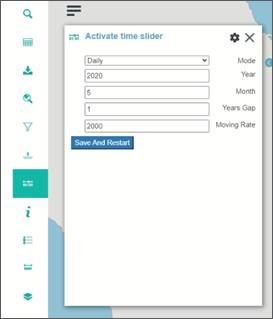
Advanced Time Slider Settings:
You can change your map’s Time Slider configuration:
|
1. Activate the Time Slider tool. 2.
Click Settings 3. Select the Mode (Year, Month, Day) 4. Change the properties as needed:
5. Change the Moving Rate (the speed at which the time animation plays) 6. Click Apply to apply the changes to the map. |
|
||||||||
|
|
|
Filter Dimensions from Table
You can filter the dataset added to your map and focus on a subset of the data. Filter the data based on
the dataset’s dimensions.
|
Note: A layer must be added to your map in order to filter the data by dimensions. Refer to Add Layer/Indicator from the Geostatistical Portal or Visualize Data in a Table. |
1. Activate the Open Table tool.
The Open table widget is displayed. It lists all the layers available on the map.
2. Choose one layer from the list to open its table. The layer’s attribute information is displayed in
a tabular format.
A
filter icon ![]() is displayed next to each
“Dimension” field.
is displayed next to each
“Dimension” field.
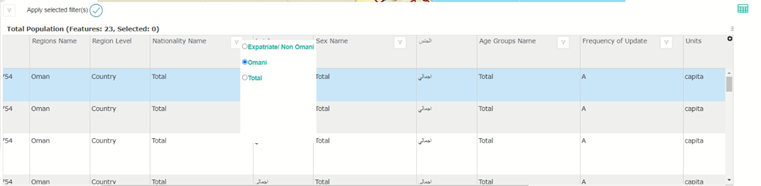
3.
Click the filter icon![]() next to the Dimension field you
want to filter. A list of dimension values is
next to the Dimension field you
want to filter. A list of dimension values is
displayed. Select the value you want to keep in your data.
|
Notice that the value chosen is directly reflected in the Filter Card and that your map is updated based on the filter. |
Repeat step 3 as many times as required (you may want to filter your dataset based on another dimension)
4.
Click ![]() to apply your filters on
the table view.
to apply your filters on
the table view.
|
Note that this filter is only available for datasets added from the Geostatistical Portal. It will not work for layers added from external sources; however you can still can filter the attribute data of these layers using the Advance Filter tool. |
Advanced Filter
With the advanced filter, you can filter the layers and datasets added to your map by building advanced
expressions.
|
Note: A layer must be added to your map in order to filter the data. Refer to Add Layer/Indicator from the Geostatistical Portal or Visualize Data in a Table or Add Layer from URL. |
|
Note: When filtering you data using the Attribute Filter, results are not reflected on the map, or in the Download Data tool. |
1. Activate the Attribute Filter tool.
The Attribute Filter widget is displayed. It lists all the layers available on the map.
2. Select a layer from the list. A list of fields available in the layer is displayed.
Build your query:
3. Double-click on a Field to select it.
4. Double-click an Operator to select it (=, is, is not, etc.).
5. Click Get unique values. All unique values within the selected field are displayed. Double-click a Value
from the list to select it.
Notice that the query has been built.
To build advanced queries, use “And”, “Or” operator and repeat steps 3 to 5.
Alternatively, type your query in the space provided.
6. Click Search.
A list of records satisfying the search query is displayed.
7. Click on a record to display its tabular properties and zoom to the record on the map.
8.
Optionally, click the Excel icon![]() to download the filtered data.
to download the filtered data.
Spatial Filter on Map
All datasets on the portal are spatially enabled, the data is available at the level of several admin boundaries.
Spatial Filter serve as the optimum tool for better display of the data.
Filter Data on a Region Level:
1. Add a Dataset from the portal to the map.
By default, the data is represented at the level of the Sultanate. Above the dimension card you can see the
Spatial Filter tool that allows you to spread the data to the other levels.
2. Choose Governorate.
The map zoom in to the governorate extent.
The data is now displayed to the level of governorates each with its unique value following the dimensions
and the time interval.
3. Choose Wilaya
The map zoom in and data is now displayed at the level of Willayat.
Filter Data to a Specific Governorate:
1. Add a Dataset from the portal to the map.
2. Choose Governorate in the Spatial Filter Tool.
An additional box appears; it includes a list of all Oman Governorates.
3. Choose ‘’Muscat’’
The map zoom in to the extent of ‘’Muscat’’. The governorate boundary is highlighted and the specific data
value of ‘’Muscat’’ is displayed.
Filter for services spatially on the map:
1. Click Spatial Filter in the tools list.
the spatial filter widget appears with advance parameters and configurations.
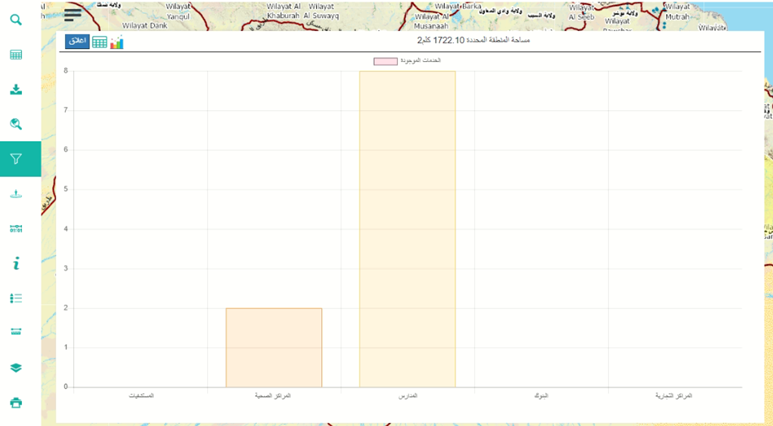
2. Choose polygon.
3. Draw a shape on the map
4. Click Apply.
The result displays the number of predefined services in the extent of the drawing, also calculate the shape area.
5. Switch the display to tabular so that the appearance of available services be as a list.
Filter for services by region:
1. Click Spatial Filter in the tools list.
the spatial filter widget appears with advance parameters and configurations.
2. Click choose region and select a governorate.
The list of Willayat is then filtered based on the chosen governorate.
3. Select a wilaya.
4. Click Apply.
The result displays the number of predefined services in the selected region extent, also calculate the shape area.
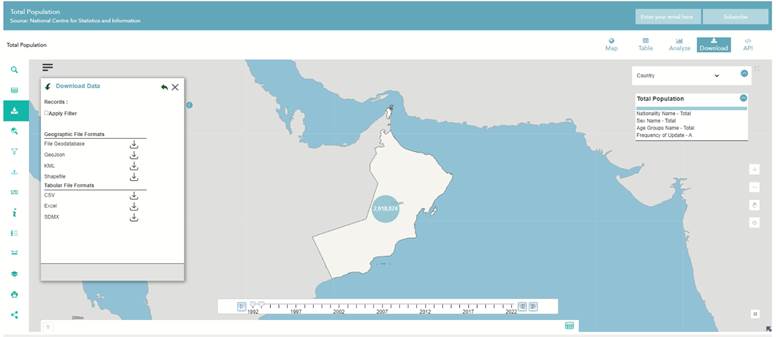
Download Data
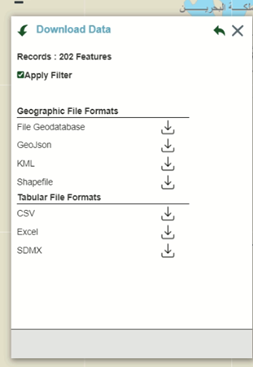
The Download Data tool allows you to download a dataset in Geographic file formats or in Tabular file formats.
1. Activate the Download Data tool.
The Download Data widget is displayed. It lists all the datasets available on the map.
|
Note: You can only download data from datasets added from the Geostatistical Portal. Refer to Add Layer/Indicator from the Geostatistical Portal or Download Data. |
|
2. Choose one layer from the list to download its data. The number of records selected in displayed.
3. To download only the selected records, click Apply Filter. If you don’t click Apply Filter, all the records in the dataset will be downloaded.
You can download data in the following Geographic File Formats: · File Geodatabase · GeoJson · KML · Shapefile
You can download data in the following Tabular File Formats: · CSV · Excel · SDMX
4.
Click The file is downloaded and is named after the dataset name. |
|
|
|
Note: Make sure your browser allows pop-ups, to be able to download the data file(s). |
|
|
Services Near Me
Near Me allows you to find available services by a specific distance in a defined location.
Find services near a defined location on the map:
1. Click Near Me in the tool list to the left.
Near me widget is displayed with further parameters and configurations.
2. Choose a service of interest (Hospitals).
Near me widget is displayed with further parameters and configurations.
3. Enter a distance and define the distance unit (10 Km).
4. Click on a location on the map.
Hospitals within 10 Km radius from the defined point are displayed. The result is listed by hospitals name
and how far it is from the indicated location.
5. Change the order between nearest or furthest.
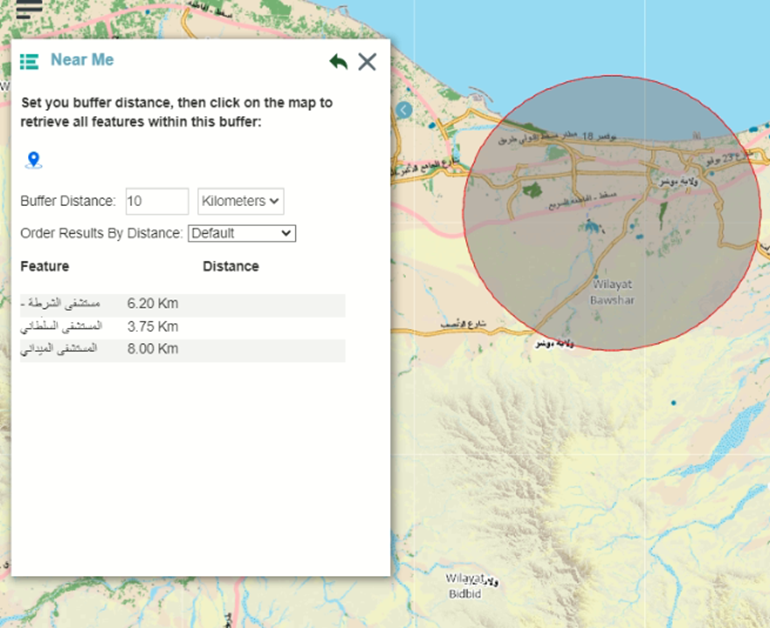
Chart Builder Interface
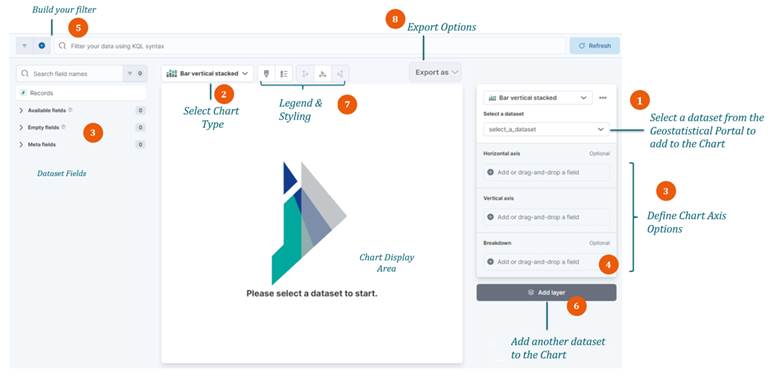
Add One/Multiple Dataset(s) from
the Geostatistical Portal 
All datasets available in the Geostatistical Portal can be analyzed in Chart Builder.
Add a Dataset
|
Add a dataset from the portal to the chart: 1.
Select a dataset from the Data view The fields of the selected dataset are displayed in the list of fields
Optionally, you can add multiple datasets to the same chart (referred to as Visualisation).
2.
Click Add Layer
Repeat steps
3. To remove a dataset from the Chart, click on the three dots and choose Delete layer.
|
|
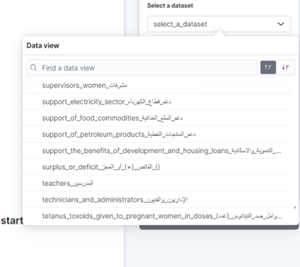
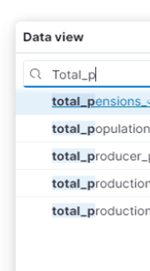
Find a Dataset
|
To find a dataset in the Data view: 1. Open the Data view.
2. Start typing the name of the dataset in the Search Box The Data view displays only the matching datasets.
|
|
Create Chart
The charting component allows you to build, edit and configure a chart as needed.
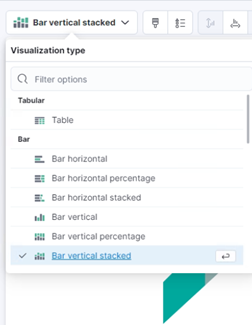
Select Chart Type 
|
|
1. Select a Chart Type from the list. Or search for a chart type to filter the list.
Once you select the chart type, the chart is automatically updated.
|
|
Note: When multiple datasets are added to the same chart, you have the option to combine multiple chart types in the same visualization. |
Define Chart Axis Options

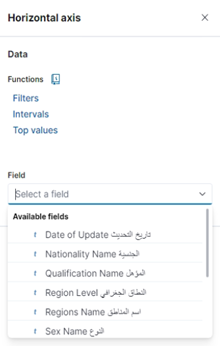
Horizontal Axis
|
1.
Click the plus sign 2. Select a field from the list. 3. Define the number of values to be displayed in the chart (5 by default).
Alternatively, you can drag a field from the Available fields list and drop it in horizontal axis.
The horizontal axis is defined.
|
|
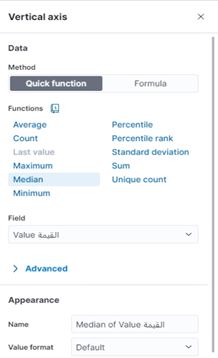
Vertical Axis
|
1.
Click the plus sign 2. Select a field from the list. 3. Select the analysis Function (Average, Count, Mean, Maximum, etc.)
Select Maximum if you want to stick to the real value.
Alternatively, you can drag a field from the Available fields list and drop it in vertical axis.
The vertical axis is defined and the chart is displayed.
|
|
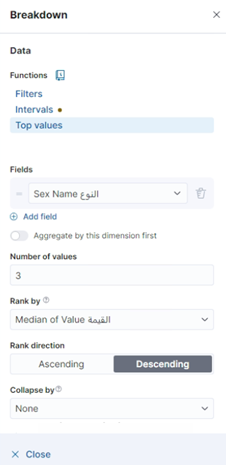
Add A Breakdown Series
Breakdown allows you to see a breakdown of a specific field values in your chart.
|
1.
Click the plus sign
2. Select a field from the list. For an optimum visualization, it is recommended that you choose a dimension field.
3. Define the number of values to consider in the breakdown function.
The chart is updated accordingly.
|
|
|
Note: You will notice that each visualization has its own settings. For example, charts have horizontal and vertical axis. Gauges have metric, minimum, maximum and goal values. |
Show Legend 
|
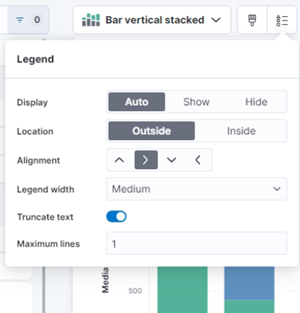
|
1. Click the Legend icon. The Legend advance configuration is displayed.
2. Click Show for legend display.
3. Optionally control the legend position, inside or outside the chart extents.
You can also control the legend width and its alignment so that it fits properly within the chart display.
|
Filter Data
Filter Data From the Chart
Filter the Data from the Chart’s Legend
|
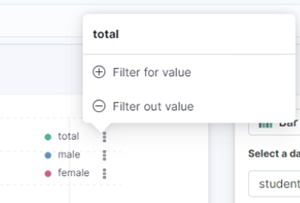
1. Display the Legend.
2. Click on the three dots besides a value in the legend.
3. Choose Filter out value. The chart is updated, filtering out (removing) the selected value.
4. Choose Filter for value. The chart is updated, keeping only the selected value. |
|
Filter the Data from the Chart Display
|
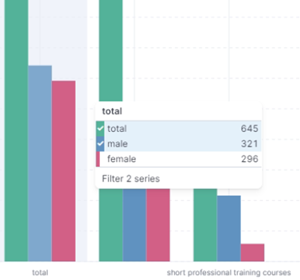
1. Hover over the data representation in the display (i.e. bars, line). A small window shows up, displaying the value you hover over broken down by the series.
2. Right Click the display The box is now fixed for the stack you have selected.
3. Click and choose the values you want to keep.
4. Click Filter series.
The chart is updated, keeping only the selected value. |
|
Build Your Filter

|
|
|
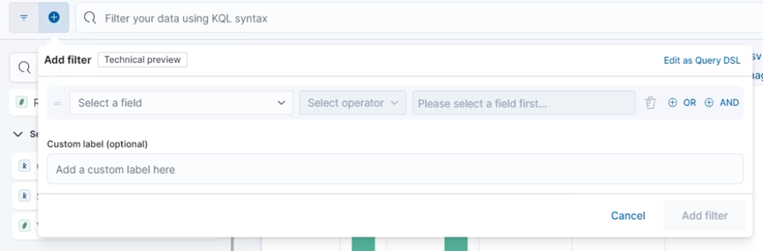
1.
Click the Plus sign A query builder box is displayed that includes options to choose: the field, the operator and the field value.
2. Select a field, an operator and a field value The chart is updated, keeping the data that satisfy your query.
To build advanced queries, use “AND”, “OR” operator and repeat step 2.
3. Click Add Filter to apply your filter to the chart.
|
|
Note: You may edit or delete your filter expression(s) at any time. |
Export Chart 
Export Chart allows you to export your data and your chart.
Export Data as CSV
You can export your chart’s tabular data into CSV format.
1. After building your chart, click on Export as > CSV.
The chart’s data is downloaded in CSV format.
Export Chart as Image
You can export your chart as an image.
2. After building you chart, click on Export as > Image.
Your chart is downloaded in PNG format.
|
Note: Make sure your browser allows pop-ups, to be able to download the data file(s). |